Dashboard Overview
The Sidekick Docker dashboard is a five-panel TUI built with Ink and React. Each panel manages a different Docker resource type.
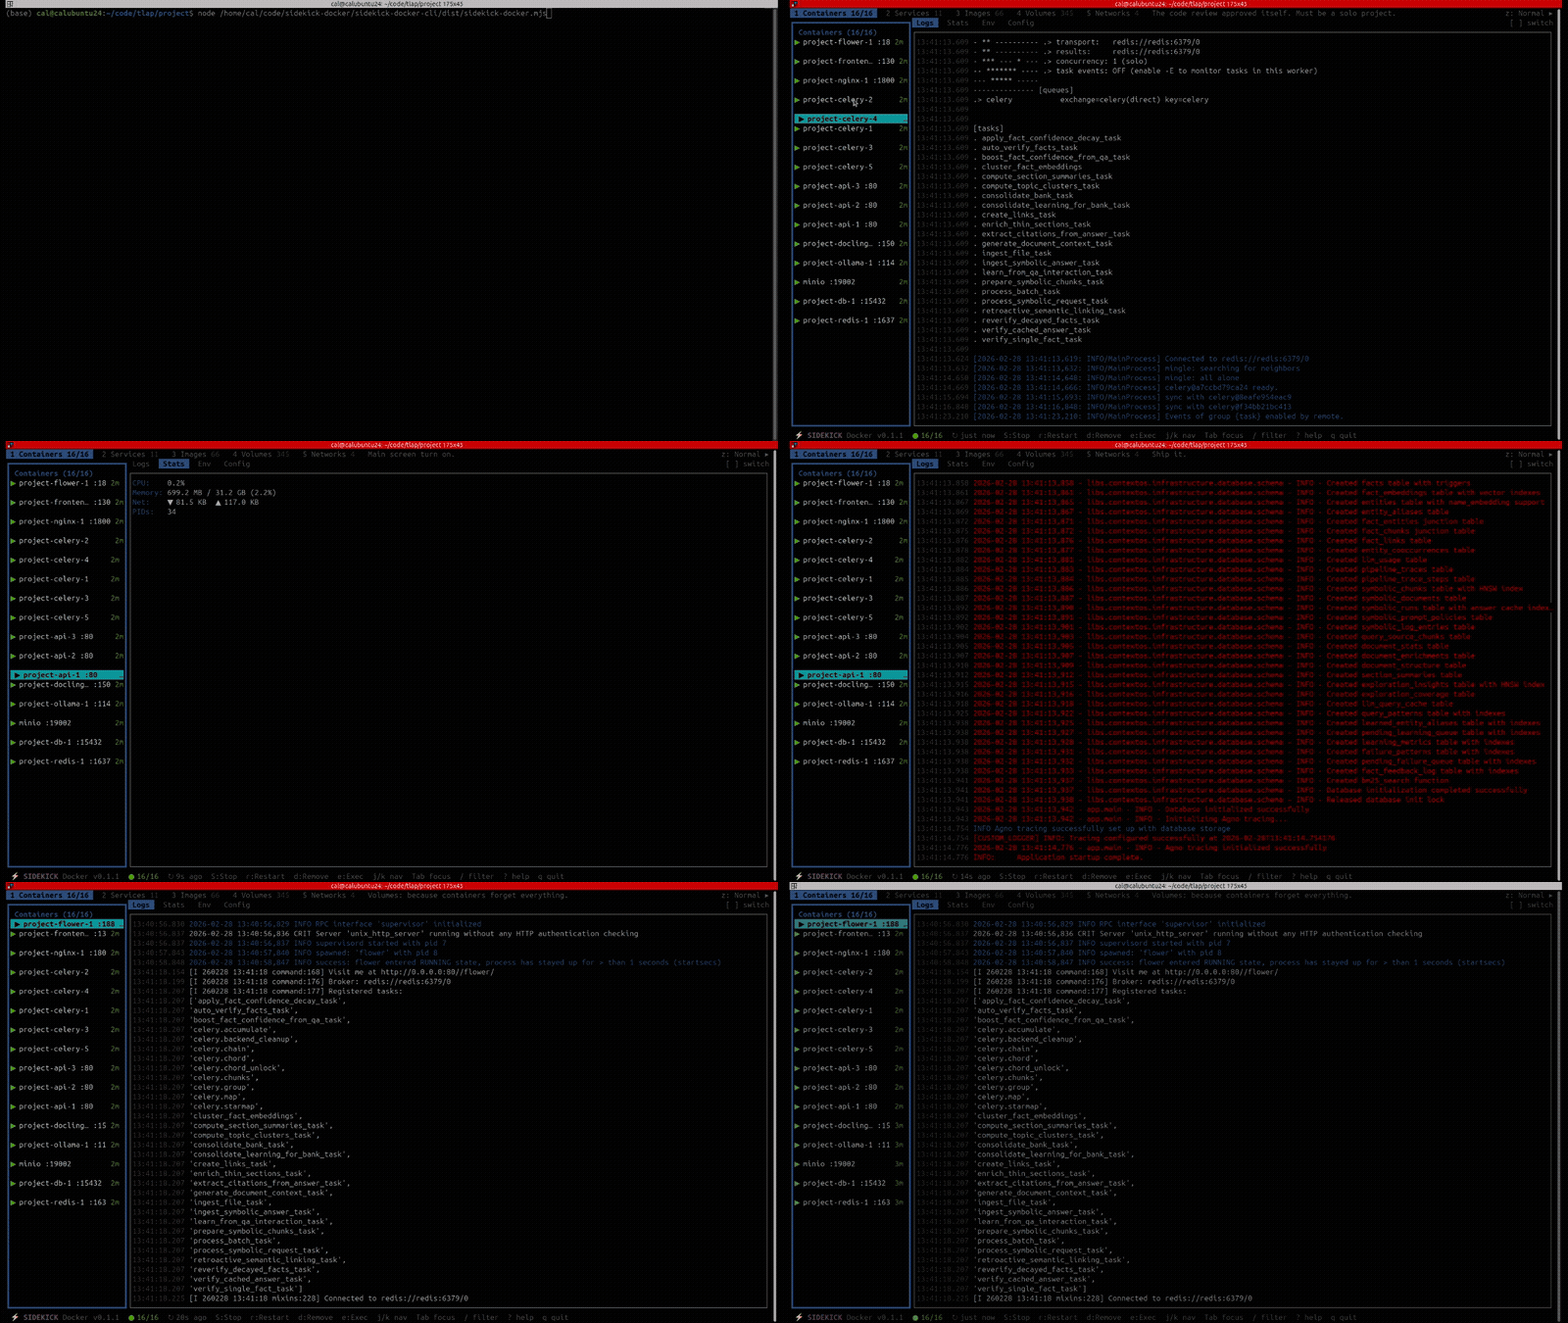
Panel Layout
The dashboard uses a split layout:
- Left pane — resource list (containers, images, etc.)
- Right pane — detail tabs for the selected item (logs, stats, configuration)
Press z to cycle layout modes: Normal (28-col side panel) → Wide (42-col side panel, showing full names) → Expanded (side panel hidden, detail pane only).
Panels
| # | Panel | Description |
|---|---|---|
| 1 | Containers | All containers with state, image, ports, uptime (+ Patterns tab) |
| 2 | Services | Compose projects and their services |
| 3 | Images | Local images with tags, size, age |
| 4 | Volumes | Named volumes with driver, mount path, usage |
| 5 | Networks | Docker networks with driver, scope, connected containers |
Switch panels with the number keys 1 through 5.
State Updates
The dashboard stays current through two mechanisms:
- Event-driven — Docker daemon events (container start/stop, image pull, etc.) are streamed in real time via
EventWatcher - Periodic refresh — a full refresh runs every 30 seconds as a fallback
This means changes appear almost instantly without manual refreshing.
Actions
Press x on any selected item to open the context menu. Available actions vary by panel — see each panel's page for details.
Destructive actions (remove, prune) are color-coded red in the context menu and require a confirmation modal that names the exact target (e.g. Remove container "web"?). y confirms; Enter, Esc, or n cancel — Enter is deliberately the safe default.
Visual Indicators
- Tab bar badges — container count is color-coded: green when all running, yellow when partially running
- Status bar — shows brand, keyboard hints, active filter, and connection status with visual separators
- Selection — focused items preserve their state icon color instead of overriding with a uniform highlight
- Detail tab bar — shows the tab label even for single-tab panels
Mouse Support
Click to select items, switch panels and detail tabs, and press overlay buttons; right-click an item to open its actions menu. The scroll wheel scrolls the pane under the cursor — scrolling up in a logs tab pauses follow (scroll back to the bottom or press G to resume).
Minimum Terminal Size
The dashboard needs at least a 60×15 terminal. Smaller windows show a resize prompt (with the exact columns/rows needed) instead of a truncated UI.
Toast Notifications
Action results appear as non-blocking toast notifications stacked in the top-right corner of the screen (just below the tab bar), with severity-specific icons and colored backgrounds. Up to three toasts are visible at once, so concurrent action results stack instead of overwriting each other. Long-running actions show a progress toast that resolves into a success toast — or an error toast carrying the actual Docker error message.